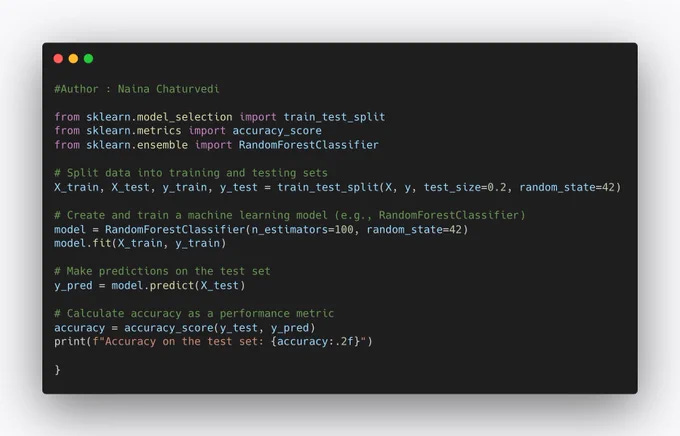
Measuring performance in ML is essential to assess the quality and effectiveness of your models.
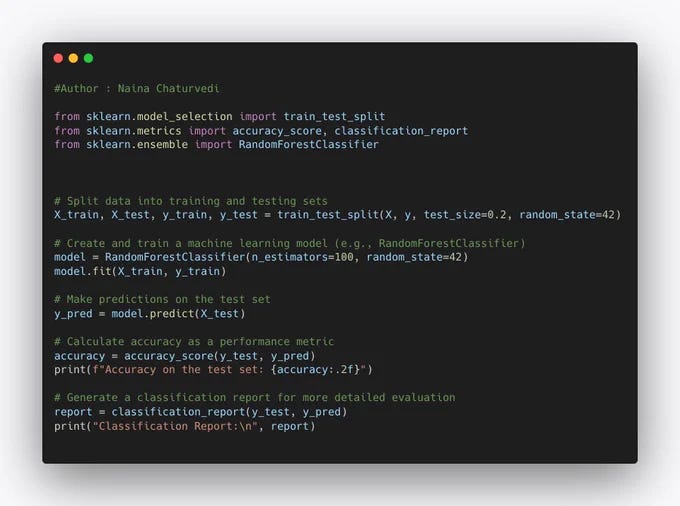
1/ It is the process of quantitatively evaluating how well a trained ML model performs on a given task or dataset. It involves using specific metrics and techniques to assess the model's ability to make accurate predictions or decisions.
2/ During Model Development: Performance measurement is an integral part of ML model development. It helps data scientists and ML engineers assess the effectiveness of different algorithms, features, and hyperparameters during the model training and selection process.
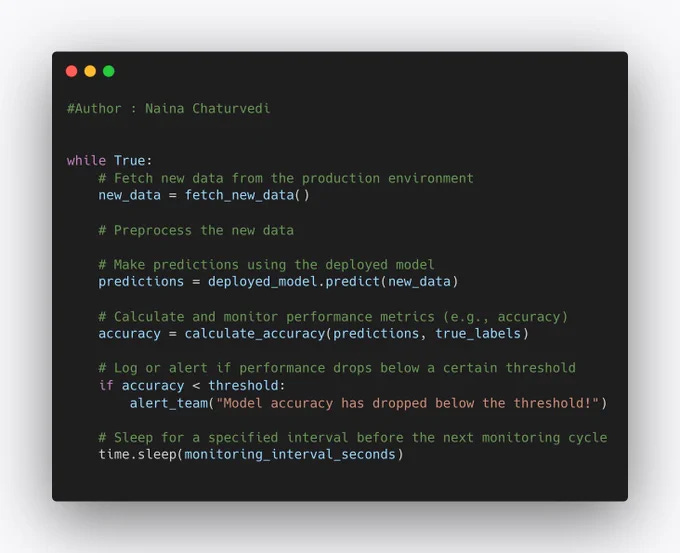
3/ After Model Deployment: Once a model is deployed in the production environment, continuous performance monitoring is essential. It helps ensure that the model maintains its accuracy and effectiveness over time.
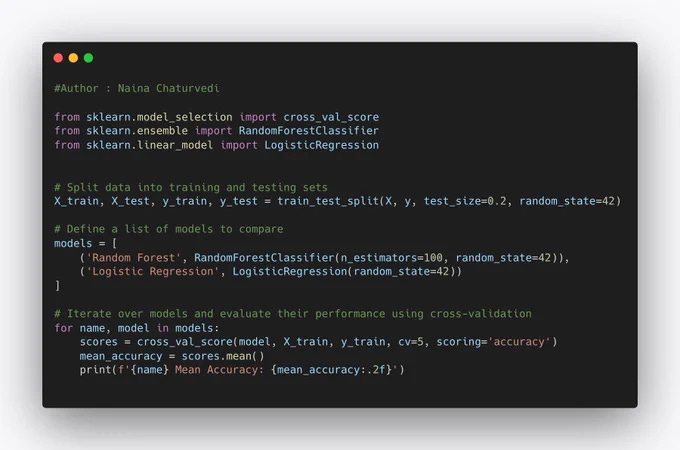
4/ Benchmarking: Performance measurement is also crucial for benchmarking different models or approaches to solve a particular problem. It allows for fair comparisons and the selection of the best-performing model.
5/ Model Evaluation: Measuring performance allows us to assess how well a machine learning model is generalizing from the training data to unseen data. This evaluation is critical for selecting the best model among different options.
6/ Hyperparameter Tuning: Performance metrics guide the process of hyperparameter tuning, where we adjust the model's settings to achieve better results. Without measuring performance, we wouldn't know which hyperparameters to choose.
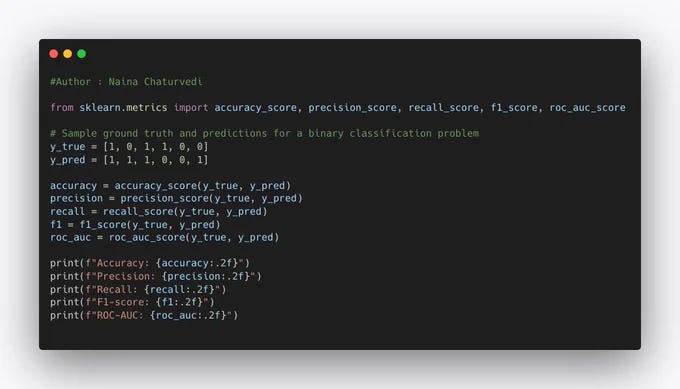
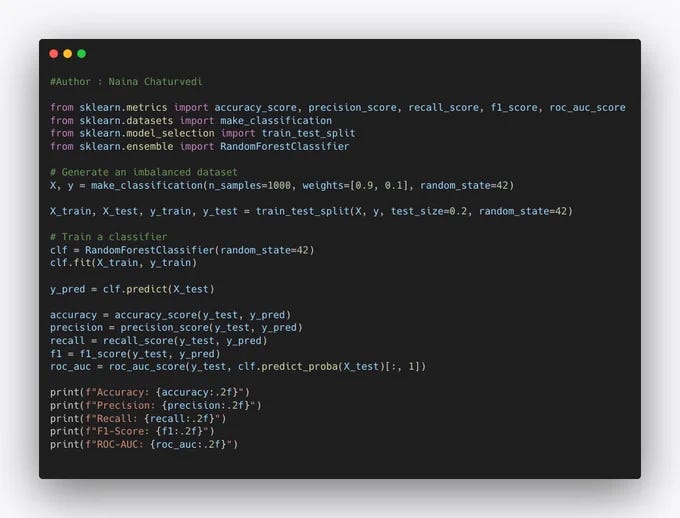
8/ Classification: Accuracy: It measures the fraction of correctly classified instances out of the total instances. Precision: It quantifies the accuracy of positive predictions. Precision is the ratio of true positives to the total predicted positives.
9/ Recall: It quantifies the ability of the model to find all relevant instances. Recall is the ratio of true positives to the total actual positives. F1-score: It is the harmonic mean of precision and recall and provides a balanced measure.
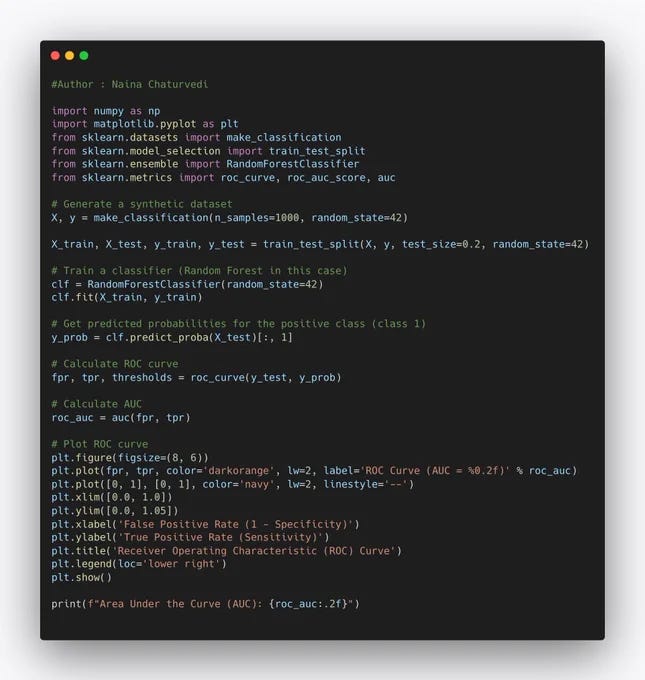
10/ ROC-AUC: Receiver Operating Characteristic - Area Under the Curve measures the model's ability to distinguish between classes.
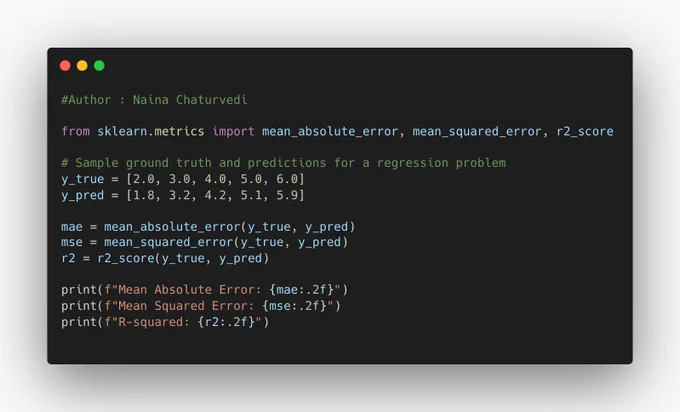
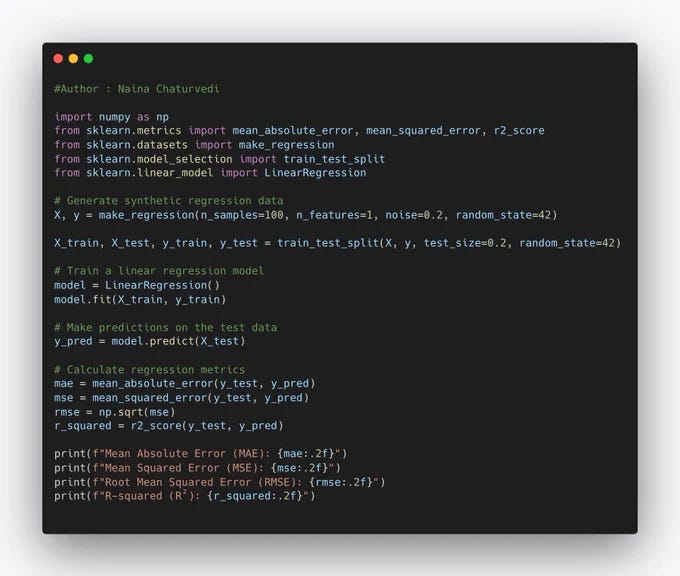
11/ Regression: Mean Absolute Error (MAE): It measures the average absolute difference between the predicted and actual values. Mean Squared Error (MSE): It measures the average squared difference between predicted and actual values.
12/ R-squared (R2): It quantifies the proportion of the variance in the dependent variable that is predictable from the independent variables.
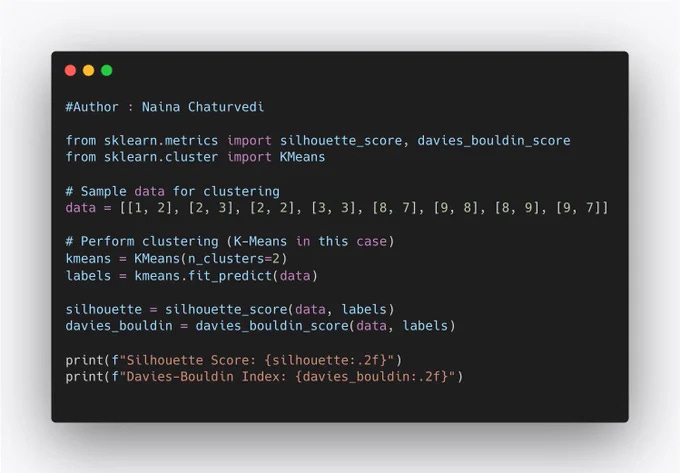
13/ Clustering: Silhouette Score: Measures how similar an object is to its own cluster compared to other clusters. Values range from -1 (incorrect clustering) to +1 (highly dense clustering).
14/ Davies-Bouldin Index: Measures the average similarity between each cluster with the cluster that is most similar to it. Lower values indicate better clustering.
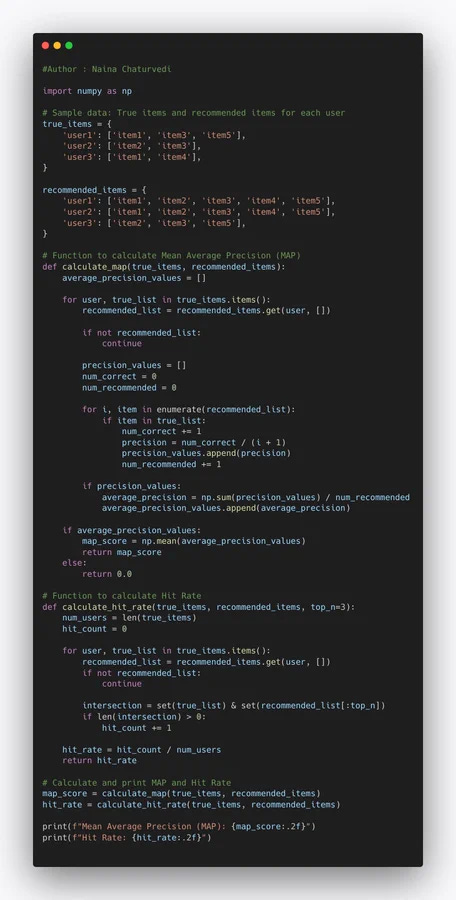
15/ Recommendation: Mean Average Precision (MAP): Measures the average precision for a recommendation system. Hit Rate: Measures the proportion of correct recommendations in the top-N recommendations.
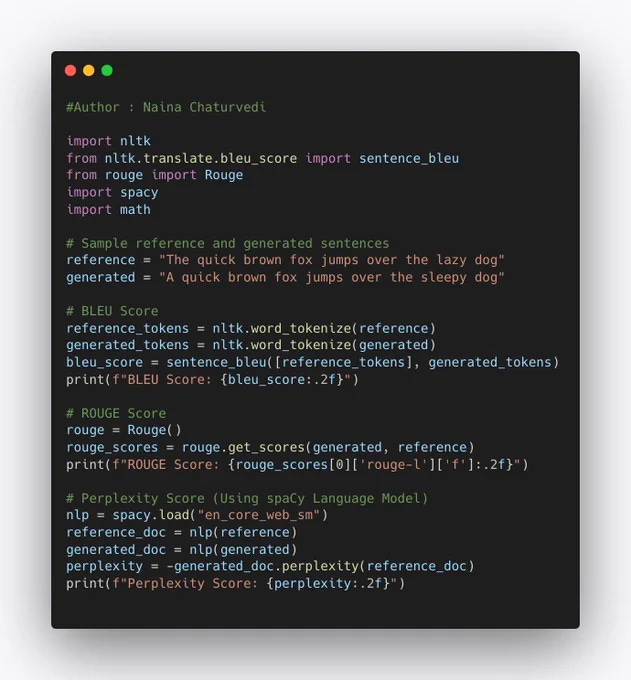
16/ BLEU (Bilingual Evaluation Understudy): Measures the similarity of machine-generated text to a set of reference texts. ROUGE (Recall-Oriented Understudy for Gisting Evaluation): Evaluates the quality of summaries and machine-generated text.
17/ In classification problems, when one class significantly outnumbers the others, it can lead to imbalanced datasets. In such cases, a model that predicts the majority class most of the time can achieve high accuracy, but it may perform poorly on the minority class.
18/ Confusion Matrix is a table that helps visualize the performance of a classification algorithm by showing the number of correct and incorrect predictions made by the model. True Positives (TP): The number of instances correctly predicted as positive.
19/ True Negatives (TN): The number of instances correctly predicted as negative. False Positives (FP): The number of instances incorrectly predicted as positive. False Negatives (FN): The number of instances incorrectly predicted as negative.
20/Accuracy: It measures the overall correctness of model's predictions. Accuracy is calculated as (TP + TN) / (TP + TN + FP + FN). Precision: Precision quantifies how many of positive predictions made by model are actually correct. Precision is calculated as TP / (TP + FP).
22/ F1-Score: The F1-score is the harmonic mean of precision and recall, providing a balanced measure that considers both false positives and false negatives. It is calculated as 2 * (Precision * Recall) / (Precision + Recall).
23/ Receiver Operating Characteristic (ROC) Curve and Area Under the Curve (AUC) are valuable tools for evaluating the performance of binary classifiers. They help assess a classifier's ability to distinguish between positive and negative classes.
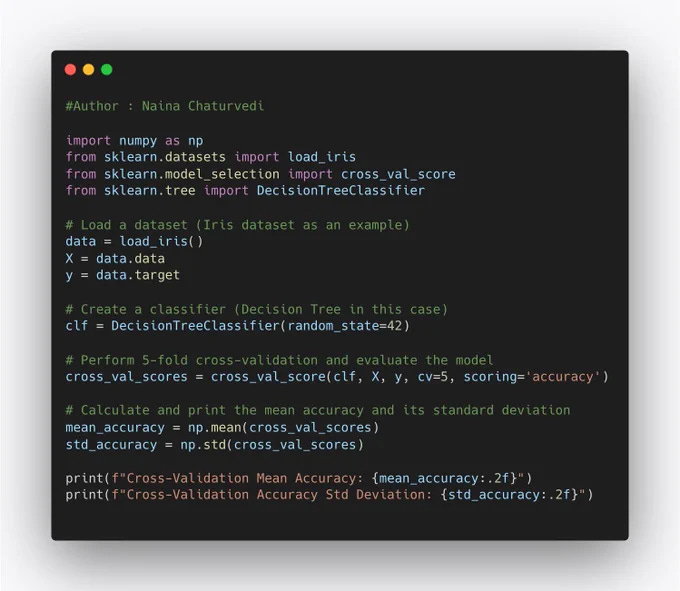
24/ Cross-validation is a crucial technique for estimating a model's performance on unseen data and reducing the risk of overfitting. It involves splitting the dataset into multiple subsets (folds) to train and evaluate the model multiple times.
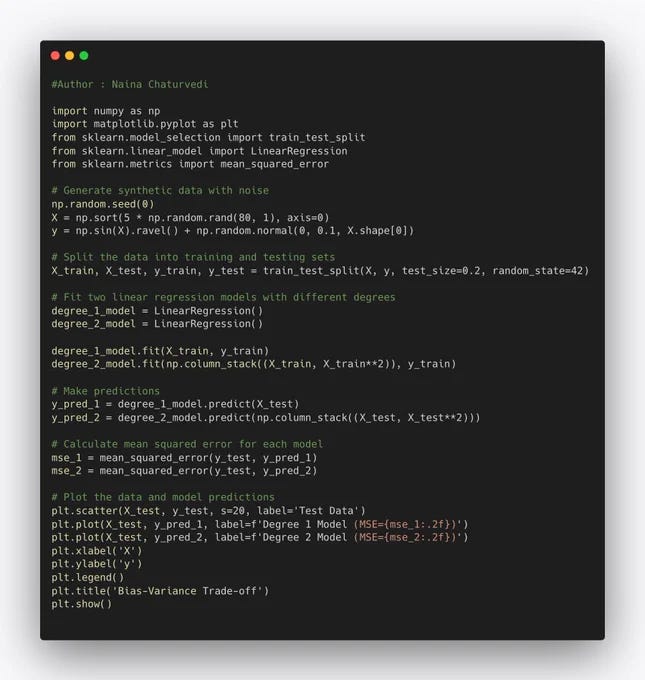
25/ Bias-Variance Trade-off is a fundamental concept that addresses the balance between two types of errors that models can make: bias and variance.
26/ Bias: Bias refers to the error introduced by approximating a real-world problem, which may be complex, by a simplified model. High bias models are typically too simplistic and make strong assumptions about the data, resulting in poor predictions.
27/ Variance: Variance refers to the error introduced by the model's sensitivity to small fluctuations or noise in the training data. High variance models are overly complex and can fit the training data too closely, capturing noise rather than the underlying patterns.
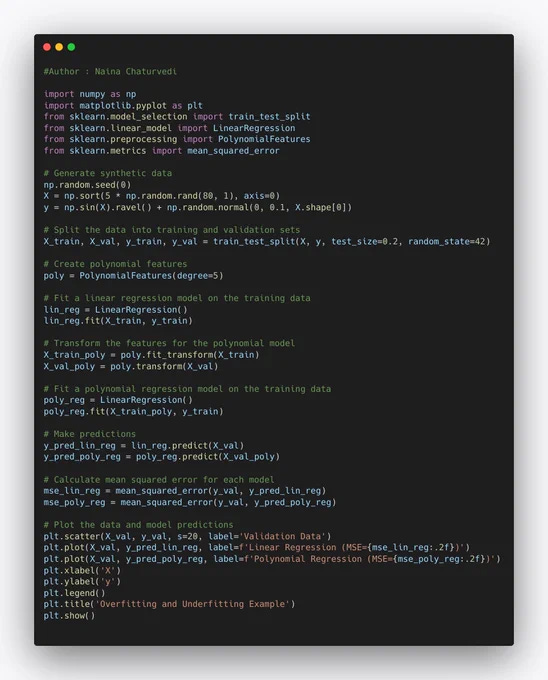
28/ Overfitting and Underfitting are common issues that arise when a model's performance on training and validation datasets indicates problems with generalization.
29/ Overfitting occurs when a model learns the training data too well, capturing noise and small fluctuations in the data rather than the underlying patterns. The model performs exceptionally well on the training data but poorly on the validation (or test) data.
30/ Underfitting occurs when a model is too simple to capture the underlying patterns in the data. The model performs poorly on both the training and validation data. There may be a minimal gap or no gap between the training and validation performance, but both are subpar.
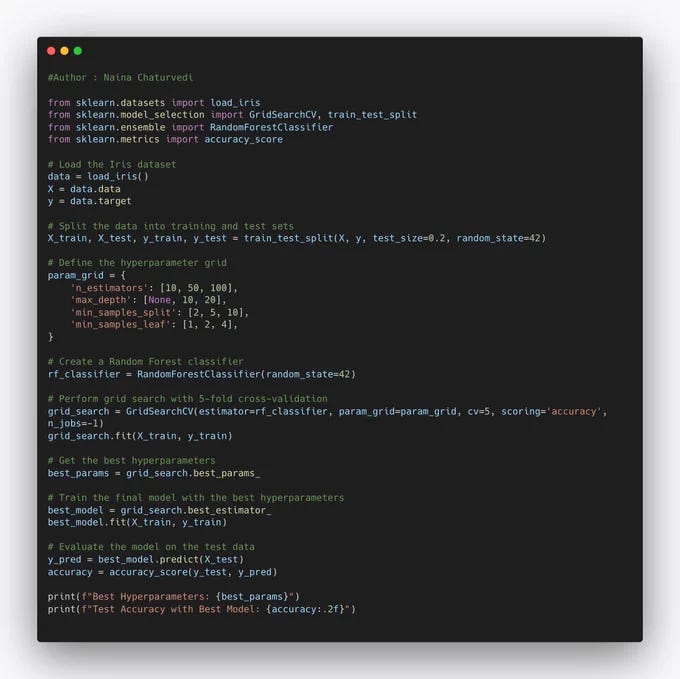
31/ Hyperparameter Tuning is the process of finding the best set of hyperparameters for a ML model to achieve optimal performance on a given task. Hyperparameters are configurations and settings that are not learned from data but are set before training the model.
32/ Feature importance measures quantify the impact of each input feature on the model's predictions. For interpretable models, understanding which features are most influential can be critical.
33/Subscribe and Read more -
Github - Github - https://t.co/nMMRf0dsvR
53 Implemented Projects
Take only these courses —
Complete Data Scientist:
Link to the course : https://bit.ly/3wiIo8u
Run data pipelines efficiently to extract, transform, and load data.
Design and conduct experiments to uncover valuable insights and drive data-based decision making.
Build powerful recommendation systems that personalize user experiences and increase engagement.
Deploy solutions to the cloud, enabling scalable and accessible data applications.
Master the essential skills needed to excel in the field of data science.
Complete Data Engineering:
Link to the course : https://bit.ly/3A9oVs5
Learn the art of designing effective data models that ensure data integrity and efficient storage.
Construct data warehouses and data lakes to enable centralized and organized data storage.
Automate data pipelines to streamline data processing and ensure timely and accurate data availability.
Gain expertise in handling and working with massive datasets efficiently.
Become a proficient data engineer equipped with in-demand skills for building robust data infrastructures.
Complete Machine Learning Engineer:
Link to the course : https://bit.ly/3Tir8ub
Acquire advanced machine learning techniques and algorithms to solve complex problems.
Develop skills in packaging and deploying machine learning models to production environments.
Master the art of model evaluation and selection to ensure optimal performance.
Learn to implement cutting-edge algorithms and architectures for superior machine learning results.
Equip yourself with the skills required to excel as a machine learning engineer.
Complete Natural Language Processing:
Link to the course : https://bit.ly/3T7J8qY
Build models that analyze and interpret human language, enabling sentiment analysis and machine translation.
Gain hands-on experience working with real data, developing practical NLP applications.
Uncover hidden patterns and extract valuable insights from textual data.
Understand the complexities of language and apply NLP techniques to solve challenging problems.
Unlock the power of language through the application of natural language processing.
Complete Deep Learning:
Link to the course : https://bit.ly/3T5ppIo
Master the implementation of Neural Networks using the powerful PyTorch framework.
Dive deep into the world of deep learning and understand its applications in various domains.
Gain hands-on experience in developing solutions for image recognition, natural language understanding, and more.
Learn about different architectures and techniques for building robust deep learning models.
Become proficient in utilizing deep learning to tackle complex problems and drive innovation.
Complete Data Product Manager:
Link to the course : https://bit.ly/3QGUtwi
Leverage the power of data to build products that deliver personalized and impactful experiences.
Lead the development of data-driven products that position businesses ahead of the competition.
Gain a deep understanding of user behavior and preferences through data analysis.
Develop strategies to optimize product performance and drive business growth.
Become a data product manager who can harness data's potential to create successful products.
Find complete Post here - Best Resources for Data Science and Machine Learning (full list)
Read about System Design 101 : Distributed Message Queue
Follow Github : Link
Projects Videos —
All the projects, data structures, SQL, algorithms, system design, Data Science and ML , Data Analytics, Data Engineering, , Implemented Data Science and ML projects, Implemented Data Engineering Projects, Implemented Deep Learning Projects, Implemented Machine Learning Ops Projects, Implemented Time Series Analysis and Forecasting Projects, Implemented Applied Machine Learning Projects, Implemented Tensorflow and Keras Projects, Implemented PyTorch Projects, Implemented Scikit Learn Projects, Implemented Big Data Projects, Implemented Cloud Machine Learning Projects, Implemented Neural Networks Projects, Implemented OpenCV Projects,Complete ML Research Papers Summarized, Implemented Data Analytics projects, Implemented Data Visualization Projects, Implemented Data Mining Projects, Implemented Natural Leaning Processing Projects, MLOps and Deep Learning, Applied Machine Learning with Projects Series, PyTorch with Projects Series, Tensorflow and Keras with Projects Series, Scikit Learn Series with Projects, Time Series Analysis and Forecasting with Projects Series, ML System Design Case Studies Series videos will be published on our youtube channel ( just launched).
Subscribe today!
Subscribe and Start today!!
Github : https://bit.ly/3jFzW01
Learn how to efficiently use Python Built-in Data Structures
Complete System Design Case Studies
Github : https://bit.ly/3jFzW01
ML System Design Case Studies Series : https://bit.ly/3i5EDiH





Absolutely insightful one...